 We’ve written before on this blog about the rise of the graph database.
Every day we speak to developers and DBAs excited by the opportunities presented by graph-format data stores, and by graph visualization.
The majority of these people are using Neo4j on the backend, of course. It’s a fantastic database, and one million downloads (and counting) makes them by far the biggest graph database around.
There’s also a smattering from other niche and newer options in the market – InfiniteGraph, OrientDB, even Google Cayley.
But one graph database that has been quietly growing in popularity is Titan.
Why use Titan for your graph project?
Historically, graph databases are terrible at scaling.
With a ‘traditional’ database (relational, key-value, document, column, etc.) horizontal scaling is a breeze. Their tabular, regular structure can shard across a distributed architecture in a consistent and stable way.
The more complex (schema-less) graph model, however, has given graph databases a reputation for being difficult – if not impossible – to scale horizontally. Networks by nature don’t tend towards isolated systems, increasing the likelihood of a look-up needing to perform expensive cross-machine traversals.
As a result, graph databases were sidelined as a niche technology, only useful for small, complex datasets.
The Neo4j team, in particular, has put huge effort into fixing the scalability concerns. Using a master-slave / load balancer architecture with concurrent processing and in-memory page cache, Neo4j 2.2 enjoyed 100x faster write and 10x fast read performance.
But what if there was a graph database designed – from scratch – to scale?
Titan Graph Database – the scalable option
The Titan Graph Database is the first graph database optimized for huge graphs.
A combination of distributed multi-machine clusters, edge compression and vertex-centric indices has given it it massive horizontal scalability. One quote claims it can run to 100bn nodes and tens of thousands of concurrent users.
It is no surprise then that Titan has such an active and enthusiastic community, despite still being in pre-release (v0.9).
And it’s no surprise that DataStax (the firm behind the Cassandra DBMS for enterprise) acquired Aurelius (the team behind the Titan project) earlier this year.
Work has started on a commercial, scalable graph database called DSE graph. We look forward to seeing the results of such a great partnership!
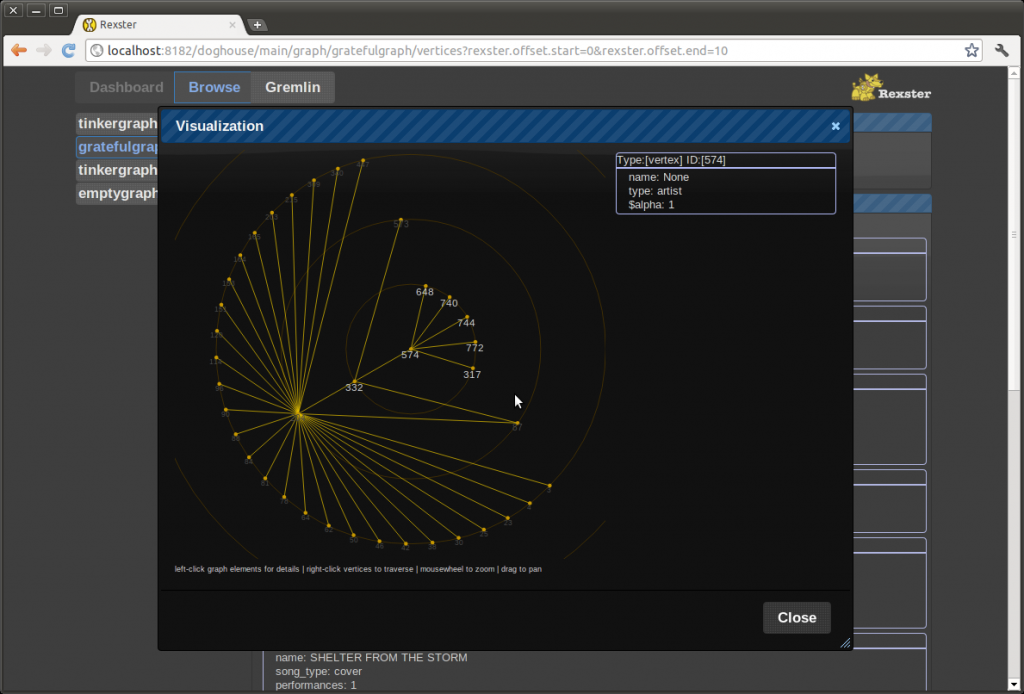
The native Titan visualization GUI
Visualizing Titan with KeyLines
Titan does come with it’s own GUI, designed for graph administration, but what if you need to give your end users a way to interact with the graph?
As a database agnostic solution, KeyLines is a popular option for visualizing Titan databases. It’s also relatively simple – with five generic steps to get data from your Titan database and into a KeyLines chart.
Before you get started, you’ll need to register for a KeyLines trial.
You might also want to download our Getting Started with KeyLines and Titan guide, which will give you more background information.
Five Steps for Visualizing Titan
Step 1: Configuration
To get data from our Titan database (on the server), into a KeyLines chart (in the user’s browser) we need to make use of the Rexster API. This transforms data from Titan into a JSON object KeyLines recognizes, and KeyLines’ AJAX requests into Gremlin queries Titan understands.
We also recommend using Apache Cassandra as the data back-end. Process calls are used to communicate between Cassandra and Titan.
You can download Titan, Cassandra and Rexster in one bundle here from the Titan Github pages.
Step 2: Load the graph
This is relatively straightforward, and the Titan team has provided good resources to help you do this: http://s3.thinkaurelius.com/docs/titan/0.5.3/index.html
Step 3: Connect to Cassandra
By default, Titan is set to use an in-memory database rather than the Cassandra database we want to use.
To change this, you’ll need to run this script in the Rexster console:
gremlin> g = TitanFactory.open('conf/titan-cassandra-es.properties') ==>titangraph[cassandrathrift:127.0.0.1] gremlin> GraphOfTheGodsFactory.load(g) ==>null
Step 4: Call the data from Titan
Once Titan is running with a Rexster front end, KeyLines can be told to submit AJAX queries to call the database. The function for this would look something like:
function callRexster(query, callback) {
  $.ajax({
    type: 'GET',
    url: rexsterURL+query,
    dataType: 'json',
    contentType: 'application/json',
    success: function (json) {
      fromTitanToKeyLines(json, callback);
     },
     error: function (xhr) {
      console.log(xhr);
    }
  });
}
Step 5: Load the data into KeyLines
The final step is to run some code that submits a Gremlin query to load your Titan data into the KeyLines chart. This would like this:
function fromTitanToKeyLines(items, callback) {
  var klItems = [];
  $.each(items, function (i, item){
    var klItem;
    if(item._type === ‘vertex’){
      klItem = createNode(item);
    } else {
      klItem = createLink(item);
    }
    klItems.push(klItem);
  });
   // now load it with a nice animation
  chart.expand(klItems, {tidy: true, animate: true}, callback);
}
And that’s it! By this point, you should see a KeyLines chart pulling data from your Titan database.

Our Titan demo application in the KeyLines SDK will teach you more about the KeyLines/Titan setup.
Try it yourself
In the KeyLines SDK you’ll find a demo application we’ve built to help you understand the visualization model a little better. Take a look, inspect the source code and see what you can build!
The post Visualizing Titan – the scalable graph database appeared first on .