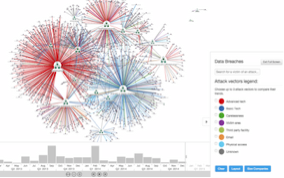
We’re pleased to announce the release of KeyLines 3.0 to all of our customers and evaluators. This latest version includes significant performance enhancements, making KeyLines the most powerful graph visualization toolkit around.
Highlights of KeyLines 3.0:
- A new WebGL rendering engine for faster, smoother visualizations
- Clever code optimizations to make your graph functions run up to 50x faster
- A new AngularJS directive and improved documentation
- 9 new demos to accelerate your project
Performance: See Bigger Graphs, More Quickly
KeyLines has always been a high performance toolkit but, increasingly, you have been asking us to help you with larger networks. To help you manage the explosive growth in your data volumes, KeyLines 3.0 harnesses the latest web technologies:
A Powerful WebGL Renderer
Since its inception, KeyLines has mostly relied on the HTML5 Canvas component to render charts in the browser. Whilst this technology is impressively fast, it can struggle with very large, dense networks.
Our new WebGL renderer offloads much of the heavy lifting to your machine’s GPU. The result is a blisteringly fast visualization experience.
Note: our WebGL renderer is initially released in Alpha form. This means we need your feedback to prepare the functionality for general release. Make sure your voice is heard! Send your thoughts to support@keylines.com.
Optimized Code for 50x Faster Calculations
KeyLines graph functions are the ‘engine room’ of our code: where you explore and analyze the connected structure of your data. This release includes a number of clever optimizations, such as dynamic cache construction; API calls are up to 50x faster than before.

More Controls, Better Controls
We’ve made a number of smaller enhancements to help you build better applications more quickly.
New Time Bar Events
Next time you check the KeyLines API, you will find a number of new events to give you more flexibility when designing your Time Bar deployment.
Navigation Controls
Perhaps our most requested minor feature to date! You can now move the location of the KeyLines navigation controls from the top left hand corner.

A New Angular Directive
Thanks to your comments and feedback, we have released a new version of our AngularJS directive. You can see this in action in our updated ‘Angular: Advanced’ and ‘Angular: Basics’ demos.
Head to the Documentation > Angular Directive tab for extensive documentation on how the directive works, and how to start a managed migration to the new version.
New Demos
Our demo applications are fun to use, but also provide great inspiration for your own KeyLines deployments. This release includes 8 brand-new demos and enhancements to many others:


Bug fixes and improvements
Of course, the release also includes a healthy batch of minor improvements and bug fixes. Take a look at our change log (Documentation > Change Log) for details.
Try KeyLines 3.0 for yourself
Already have an account for the KeyLines software development kit? Just log in to see the new functionality in action. Alternatively, you can request a free trial.
As always, don’t forget to tell us what you think. Send us your questions, opinions and suggestions – we would love to hear from you!
The post Introducing KeyLines 3.0: Supercharge your Charts with WebGL appeared first on Cambridge Intelligence.


